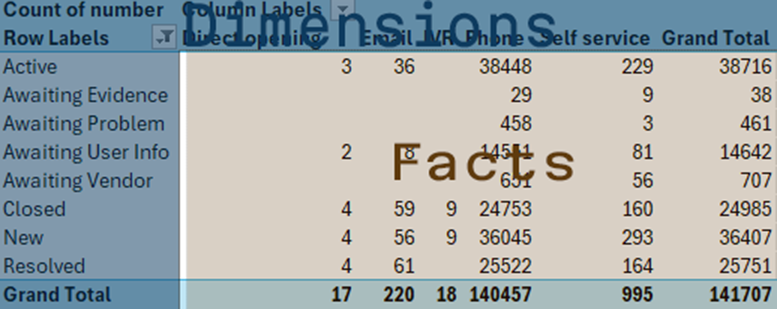
When modelling data in Power BI and the entire Power Platform, the Kimball Schema, also known as the Star Schema, is the method of choice. It separates data into Facts and Dimensions, offering an efficient approach to data analytics. While it may seem challenging at first, especially when transitioning from other methods, the efficiency of the Kimball Schema becomes more apparent with practice. Last week, we explored dimensions; now, it’s time to delve into the intriguing concept of the “Facts about facts”!
The Kimball Schema is optimised for storage and analysis. It unifies dimensions in an event or “Fact”, creating what is known as a Fact Table. The idea of multiple tables can be confusing at first, but they are ‘Joined’ using ‘Keys’. The default Join or Relationship is known as a ‘one-to-many’, which means that one record from the first table matches many rows of the other table it is joined with. In practice, Dimensions form one side of these relationships, and the many sides are facts. The two columns linking the tables are the Primary Key (One side) and the Foreign Key (Many side).


The result is that fact tables, in their optimal composition, are made up of “Foreign Keys” and numbers. The Foreign Keys represent the link back to the various dimensions that go into making up the remainder of the model. The numbers are then aggregated, often a simple SUM( ), but AVERAGE( ) or COUNT( ) are also typical.
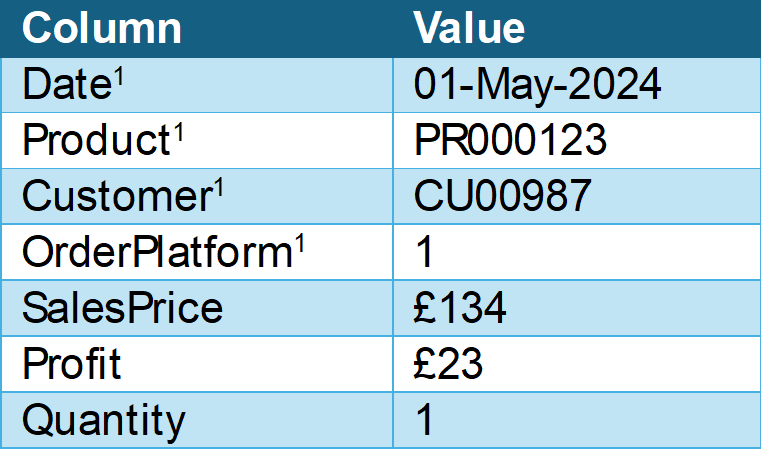
As you can see, your facts make up the “Events” that occur in a process. For example, the Sales fact table will have dimensions like Date, Product, Customer, and Order Platform, with a Sales Total (£), Profit (£), and Sales Quantity making up the rest of the table.
Understanding the interplay between Facts and Dimensions is the heart of data modelling, and getting this right with the correct relationships will allow you to do much more with your DAX measures.
Let’s pretend one row of our Sales fact table looks like this. (Right)
To understand how this provides Analysis, recall that the Foreign Keys (marked with a 1) are all connected to a record for that item. For example, Product (PR000123) would belong to a Category and sub-category, not just a product name. This allows us to look at SUM ( Sales[SalesPrice] ) by Product Category. Also, the aggregations are all done consistently against the column, with the foreign keys acting to filter the table effectively and give a filtered column for aggregation quickly and easily. When you expand that to consider ALL the dimensions referenced with a Foreign Key, you suddenly have a vast range of analyses.
Geordie Consulting specialises in business intelligence and analytics, helping clients across a range of sectors use their data and gain insights. We provide data modelling, reporting, dashboard creation, and forecasting services. Our team of skilled and qualified experts employ the Microsoft Analysis Steck (Power BI and Fabric) to offer solutions that match your requirements and exceed your expectations. Geordie Consulting is your partner for accomplishing your goals and objectives.
