Our current YouTube series is focused on the concept of a Single Pane of Glass for reporting, a term that is often used but not always understood. In simple terms, it means establishing standards and a common platform for reporting within your organisation. This approach, known as a Reporting Plain, can greatly streamline your reporting processes.
Microsoft Power BI is an ideal solution for this as it supports not just the separation of skills but also the building and management of the dedicated reporting spaces needed for a Reporting Plain. Typically, the role of data and analytics is to form the link between activity and analysis or, more appropriately, to visualise what happens within the organisation. All too often, this reality shapes entire reporting landscape however within it is the failure of a true Reporting Plain.


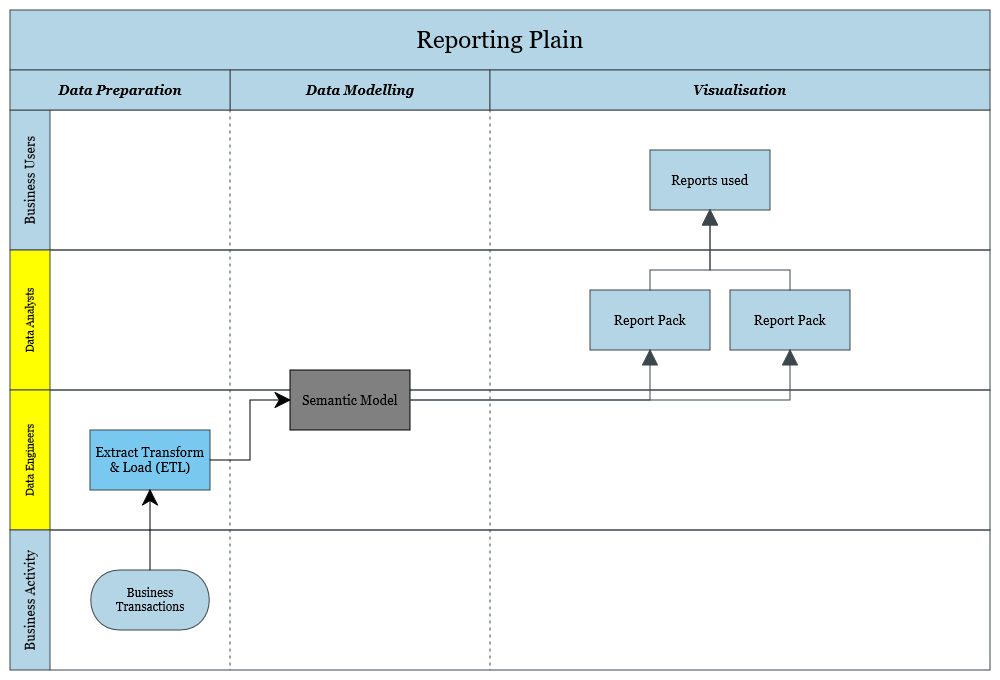
The traditional reporting flow shown above is what is typically used to define reporting projects, and this often becomes the template that is used for all elements of a business; this is the mistake many make when they are looking to implement Power BI. Power BI Workspaces are often used excessively sparingly. We have found that success comes from using your Workspaces for specific tasks or objectives. We recommend having three “Classes” in the workspace within your organisation: data processing, data modelling, and visualisation. These can be seen to mirror the traditional reporting structure and it broadly does, the change comes as we recommend considering the whole model in three dimensions. Initially start by considering the Report Packs.
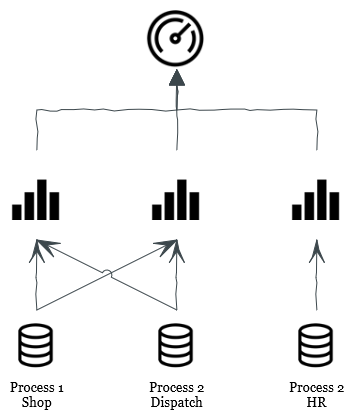
Suppose we need to produce content for a Senior Leadership Team. In that case, we will create a report pack from each source and either provide multiple separate reports to them or someone will manually collate them into a single report (PowerPoint). The Single Pane of Glass, however, is to establish specific workspaces by function, then bring report content from all relevant Semantic Models into it.

With this approach, the objective shifts from building multiple separate reporting models but to drawing the strands of reporting together, providing a clearer and more comprehensive view of the business. This is where the traditional mechanism of implementing Power BI often falls short, as the objective is to deliver a specific report. This then leads to future activity usually replicating the solution rather than aiming to fold the following use case into the delivered solution for the first.
Brining your business to the point that you can leaverage and benefit from this is a difficult journey as it increases the complexity and the skill level needed to implement each new report data solution. The benefits gained from a complexity increase make the challenge well worth undertaking and of course we are always available to support you.
Geordie Consulting is a business intelligence and analytics company that helps clients across multiple sectors leverage their data and gain insights. It offers services such as data warehousing, data integration, data visualisation, dashboard development, reporting, and predictive analytics. We have a team of experienced and certified consultants who use the latest tools and technologies to deliver solutions that meet the client’s needs and expectations. Geordie Consulting is your trusted partner for help achieving your goals and objectives through data-driven decisions.