As analysis gets bigger and bigger it becomes increasingly difficult to maintain the levels of detail required within a model and also deliver the pace of analysis that is required. Let us start by being clear that the core purpose of analysis is to facilitate the aggregation of data to enable the testing hypothesis or the tracking of activity. Aggregation is at the heart of everything we do and some aggregation is done on demand – DAX measures while others are done to enable speed of analysis.

Why is this relevant?

Many of you reading this will think “I don’t do any aggregations, why is the relevant?” The relevance comes when we recognise that we are not going to just use simple SUM ( ) or AVERAGE ( ) aggregations. In fact, the challenge that we are often faced with in the real world of analysis is to be able to assess Millions of transactions while also retaining the detail of any particular transaction. All while remembering modern analytics is columnar in its storage and processing. This means that we are not just advised and taught to keep our Fact Tables narrow, the platform performance makes it vital that we do. So how can we balance the requirements of the platform and our audience? The simple answer is with two capabilities offered by Power BI. Direct Query and Aggregation Tables.

Direct Query

Direct Query is a powerful tool that allows you to link a table to data in your report pack and process it remotely. This remote processing ensures that the non-optimized data never needs to be included within your data model, thereby providing you with a vast amount of data, most of which, by definition, will never be accessed.

Aggregation Tables

The critical thing to recognise about Direct Query tables is that most of their contents will never be accessed or used. So, what will be used most frequently should be brought into an aggregation table. An aggregation table is therefore the purest form of a Fact table only including the required aggregated values.

The vast majority of Aggregation Tables are aggregated against the Calendar Table, but that is not a hard requirement. There is also not rule that says you should not set up aggregation tables at multiple levels or granularity. Let us walk through a recent solution we provided a client.

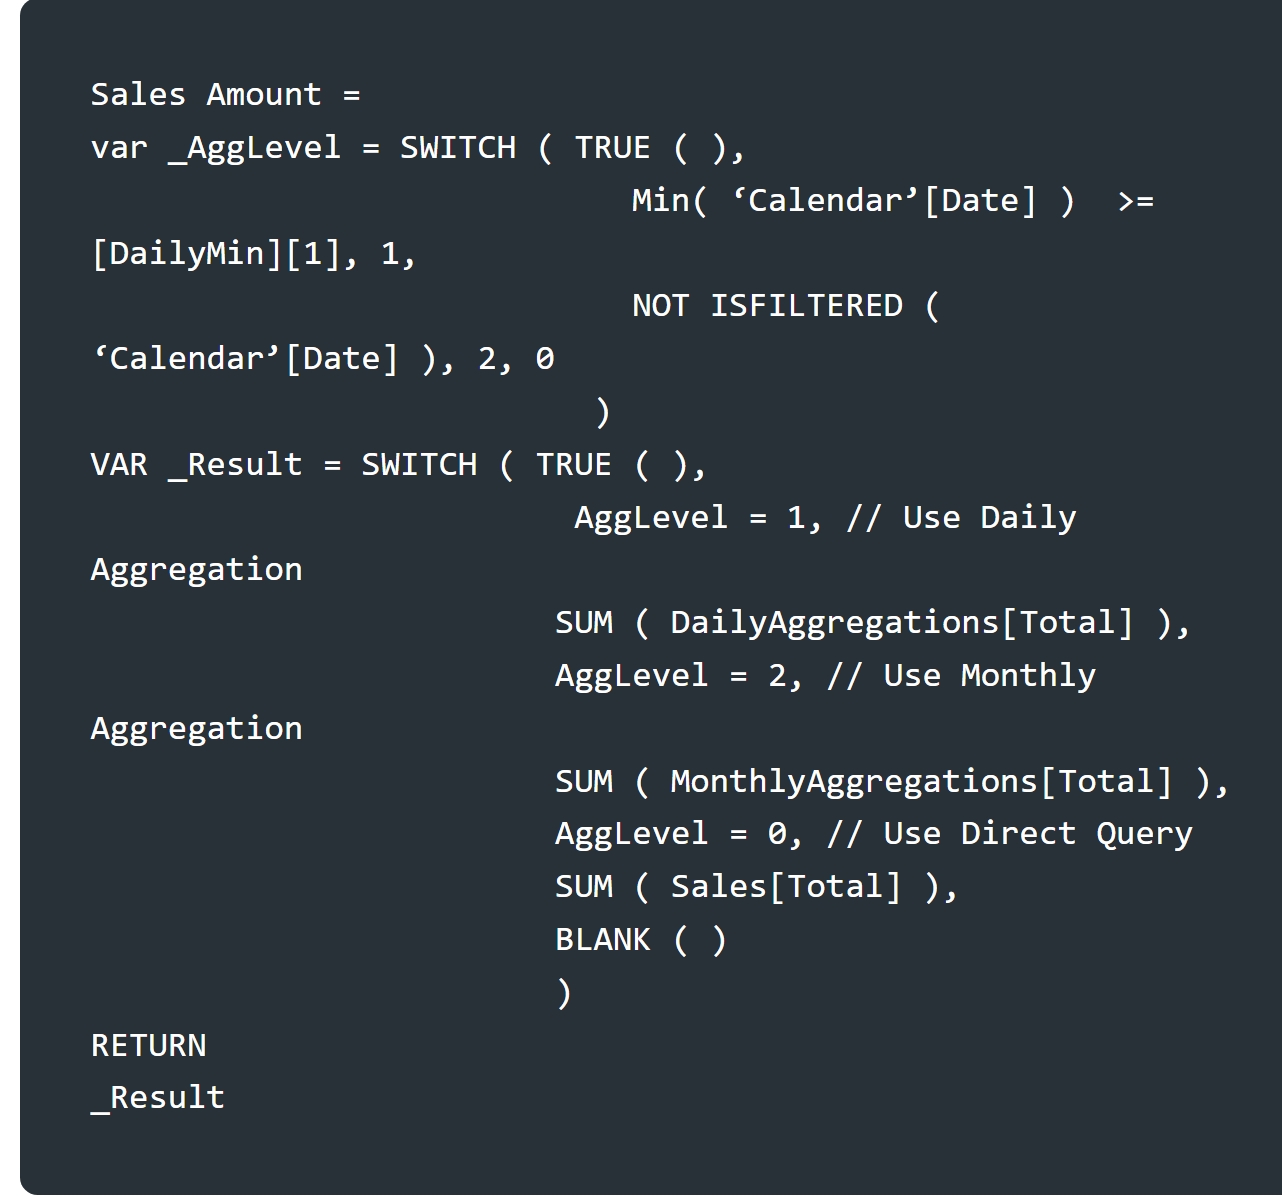
This model essentially offered three versions of the Transactions (Fact) Table. These are accessed and utilised based on the context that the measure is used in.

The structure of the aggregation tables used here are based around the granularity of Daily initially before switching to Monthly. This could be changed over time if required for optimisation reasons.

Sample Schema:

becomes…

In the example we have used, we have two aggregation tables, a Daily version and a Monthly Version. The two do not overlap, meaning that for the first historic three months, there is a daily set of data that can be analysed to assess performance. This allows for “Month To Date” and “Prior Month to Date” comparison. However, “Previous Years Month to Date” is not possible, as there would only be a whole month value. This compromise however mean that you can have the capability of having many years of historic data as opposed to a year or so if you had daily data or a few month if you have transaction level data. So amount of historic data is the driver for these aggregations where having the ability to run longer term analysis out weights the extra value of the transactional data. The lack of granularity a monthly aggregation set has is mitigated by having the last three months available with a daily aggregation. Remember days are the most common minimum time period for analysis so things will most normally be analysed as a minimum of a day level.

Note that there is a theoretical limit to how many additional ID columns there should be within your aggregation table as each new addition will potentially multiple rows, eventually undoing any benefit gained by using the aggregation tables, based on the sample above you may decide to aggregate for example on ProductCategoryID rather than Product depending on how many products your company sells. This highlights the compromise that goes into our aggregation strategy, the objective being to ensure that most of the analysis can be done with the aggregations as rapidly as possible. Get your aggregation strategy right, and you will slash the size of the Semantic Model your report uses, making it much more performant. If you get it wrong, you may not have a functioning model.

Building your aggregation table

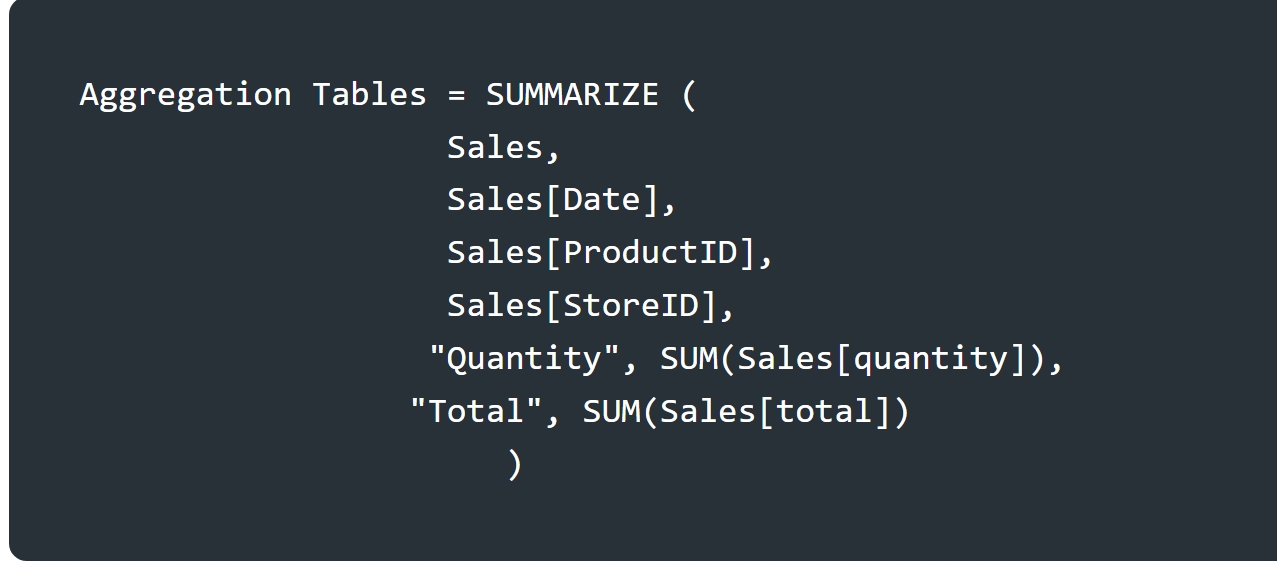
Our example aggregation tables were build during the ETL phase, a Dataflow was used to run a “Group By” against the transaction table, either on a Monthly or Daily granularity. You may find that you are able to build an Aggregation Table using DAX however the row count will be a significant factor in that as you will have the 1,000,000 row limit of Direct Query to contend with, in DAX the sample table would above would be calculated using:

Geordie Consulting, a dedicated consultancy, has partnered with numerous companies to tackle this challenge. We are committed to sharing our expertise and experience with clients by supporting your Centre of Excellence. Our consultants and their knowledge will be available to foster the growth and development of this function within your organisation. Our team will oversee your Power Platform estate, ensuring consistent refresh cycles. Additionally, we will mentor your team or facilitate knowledge-sharing events to promote a new Data Culture within your business. As a Microsoft Partner, we ensure our team stays current with platform updates. We can simplify the upskilling process for your internal team by guiding and supporting their learning and demonstrating solutions implemented during your engagement. To optimise your return on investment, consider enrolling your organisation in our Centre of Excellence as a Service offering.

If you enjoyed this blog post and want to dive deeper into Aggregation of Data, visit our YouTube channel and learn all things Data Analysis from our lead consultant.